
| Global Stock Market Overview | |
|---|---|
| Largest Exchange | NYSE (New York Stock Exchange) |
| Global Peak Volatility | 09:30 AM to 11:30 AM EDT (EU/US Overlap) |
| The Macro Trinity | GDP, CPI (Inflation), and Interest Rates |
| Key Leading Indicator | US Dollar Index (DXY) |
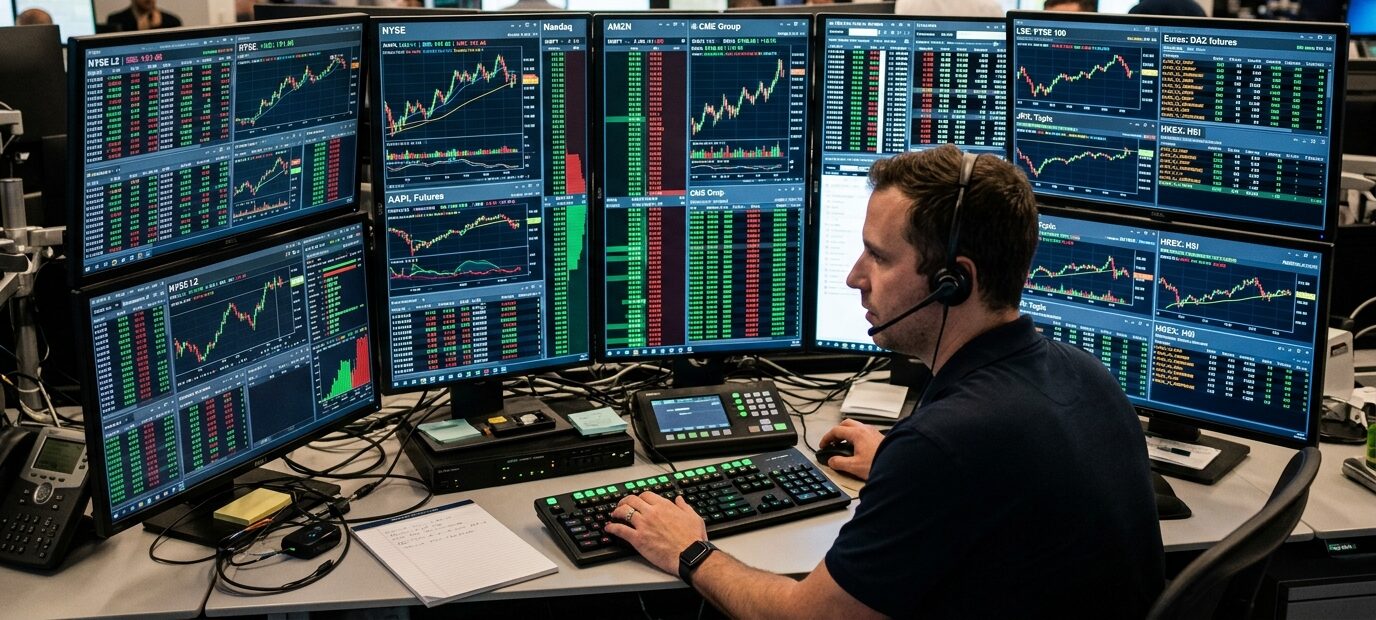
| Order Flow Metrics | Level 2 Data, DOM, Dark Pools, Iceberg Orders |
| Derivative Markets | Options (Calls/Puts), Futures Contracts |
| The Options “Greeks” | Delta, Gamma, Theta (Time Decay), Vega |
| Algorithmic Volume | Over 90% of global institutional execution |
| Key Market Regimes | Accumulation, Markup, Distribution, Markdown |
| Risk Management Rule | Fixed Fractional Sizing (1% Risk Rule) & Expectancy |
| Behavioral Biases | FOMO, Revenge Trading, Confirmation Bias |
| Modern Trading Evolution | AI Agents, Deep Learning, Cloud Execution |
The global stock market operates as a highly complex, adaptive ecosystem where macroeconomic fundamentals, geopolitical undercurrents, algorithmic execution, and human psychology continuously intersect. It is not merely a venue for buying and selling corporate shares; it is the central nervous system of global capitalism, dynamically pricing the future expectations of the world’s largest economies in real-time.
For market participants—ranging from multi-billion dollar institutional quantitative funds to retail day traders—navigating this environment requires a multidimensional skill set. Success is not derived from a single secret indicator, but from a synthesized understanding of exchange infrastructures, derivative markets, dark pool order flow, advanced technical chart topography, and rigorous, mathematically sound risk management protocols. This exhaustive report deconstructs the mechanics of global stock market trading, providing an expert-level, end-to-end educational framework for understanding how capital truly flows across the globe.
The Intermarket Ecosystem
The global stock market is staggering in scale. It is wild to think that a political event in Europe or an interest rate change in the United States can trigger algorithmic trading bots in Asia within milliseconds. Billions of dollars can move across continents almost instantly, showing how deeply interconnected and fragile the system has become. What once took hours or days to ripple through economies now happens faster than human comprehension.
Trading today is no longer just about picking strong companies. It has evolved into a high-speed game of psychology, risk management, and data analysis. Algorithms compete in microseconds, investors react to headlines in real time, and entire markets shift based on sentiment as much as fundamentals. The sheer speed and complexity make the stock market both a marvel of modern technology and a reminder of how delicate global finance truly is.
1. Global Equity Market Infrastructure: The Mega-Exchanges
The foundation of stock market trading rests upon the infrastructure provided by global exchanges. These institutions serve as the central clearinghouses for capital formation and liquidity provision. The global equity market is heavily concentrated, with the top ten largest stock exchanges collectively representing over 80% of global equity market capitalization.
The New York Stock Exchange (NYSE), founded in 1792, remains the undisputed global leader, generating a monthly trade volume exceeding $2.7 trillion. It is home to the Dow Jones Industrial Average and the broader S&P 500, the primary benchmarks for US economic health. Conversely, the NASDAQ remains the epicenter for global technology and innovation, tracking mega-caps via the NASDAQ-100.
In Asia, the landscape is rapidly expanding. The Japan Exchange Group (JPX) tracks the world-renowned Nikkei 225 and the broader TOPIX. Meanwhile, the Shanghai Stock Exchange (SSE) and Shenzhen Stock Exchange (SZSE) represent the engine of mainland Chinese capital. The National Stock Exchange of India (NSE) and the historic Bombay Stock Exchange (BSE) experienced explosive year-over-year growth, solidifying the NIFTY 50 and SENSEX as critical global emerging market benchmarks.
Beyond the top ten, other critical regional hubs include the Toronto Stock Exchange (TSX) (dominant in global mining and energy), the Frankfurt Stock Exchange (driving the German industrial economy via the DAX), the SIX Swiss Exchange, the Australian Securities Exchange (ASX), the Korea Exchange (KRX), the B3 in Brazil, and the Johannesburg Stock Exchange (JSE) anchoring the African continent.
| Rank | Exchange & Region | Market Cap (USD) | Primary Indices & Significance |
|---|---|---|---|
| 1 | NYSE (North America) | $31.58+ Trillion | S&P 500, Dow Jones. The undisputed global leader hosting legacy mega-caps. |
| 2 | NASDAQ (North America) | $30.60+ Trillion | NASDAQ-100. The global epicenter for technology, bio-tech, and innovation. |
| 3 | Shanghai (SSE) (Asia) | $8.92+ Trillion | SSE Composite. The primary engine of mainland Chinese state and corporate capital. |
| 4 | Japan (JPX) (Asia) | $7.80+ Trillion | Nikkei 225, TOPIX. Anchors East Asian finance, highly sensitive to yen fluctuations. |
| 5 | Euronext (Europe) | $7.30+ Trillion | CAC 40, AEX. A pan-European exchange connecting Paris, Amsterdam, and Brussels. |
| 6 | Hong Kong (HKEX) (Asia) | $6.20+ Trillion | Hang Seng Index. The critical gateway for international capital accessing China. |
| 7 | India (NSE) (Asia) | $5.32+ Trillion | NIFTY 50. The fastest-growing major emerging market exchange globally. |
| 8 | Bombay (BSE) (Asia) | $5.25+ Trillion | SENSEX. Asia’s oldest stock exchange, operating in parallel with the NSE. |
| 9 | Shenzhen (SZSE) (Asia) | $4.47+ Trillion | SZSE Component. China’s tech-heavy counterpart to the Shanghai exchange. |
| 10 | London (LSE) (Europe) | $3.80+ Trillion | FTSE 100. A historic financial hub bridging the gap between Asian and US markets. |
2. Temporal Dynamics: The 24-Hour Cascading Cycle
Unlike the foreign exchange (Forex) market which runs 24/5 continuously, global stock markets operate on a strategic distribution of exchange hours. This creates a cascading sequence of liquidity across the globe. Institutional capital relies heavily on specific time windows, particularly market opens, closes, and regional overlaps.
The Asian session initiates the global trading day. Notably, major Asian exchanges enforce a mandatory lunch break (e.g., Tokyo from 11:30 to 12:30 JST), during which liquidity plummets. The European session, led by London and Euronext, creates the bridge between Eastern and Western markets. The most critical period of the day occurs during the overlap between the European close and the US morning session (09:30 AM to 11:30 AM EDT). This window is characterized by peak global volatility, immense institutional order execution, and the highest frequency of algorithmic trading activity.
| Exchange | Pre-Market (Local) | Regular Trading Hours (Local) | Lunch Break | After-Hours (Local) |
|---|---|---|---|---|
| NYSE / NASDAQ (US) | 04:00 – 09:30 EST | 09:30 – 16:00 EST | None | 16:00 – 20:00 EST |
| London (LSE) | 05:05 – 07:50 GMT | 08:00 – 16:30 GMT | None | None (Off-book only) |
| Tokyo (JPX) | 08:00 – 09:00 JST | 09:00 – 15:30 JST | 11:30 – 12:30 JST | 15:30 – 16:30 JST |
| Hong Kong (HKEX) | 09:00 – 09:30 HKT | 09:30 – 16:00 HKT | 12:00 – 13:00 HKT | 16:15 – 03:00 HKT (Derivs) |
| India (NSE / BSE) | 09:00 – 09:15 IST | 09:15 – 15:30 IST | None | 15:40 – 16:00 IST (Closing) |
3. Regulatory Frameworks, Broker Routing, and PFOF
Retail and institutional traders operate under distinct jurisdictional umbrellas that dictate leverage limits, margin close-out rules, and the segregation of client funds.
| Regulatory Tier | Authority & Region | Characteristics and Leverage Limits |
|---|---|---|
| Tier 1 (Strict) | SEC / FINRA (USA) | Strict capital requirements; Pattern Day Trader (PDT) rule applies ($25k minimum); extremely limited retail leverage. |
| Tier 1 (Strict) | ESMA / FCA (Europe/UK) | Enforces negative balance protection. Leverage strictly capped at 5:1 for individual equities. UK completely bans crypto derivatives for retail. |
| Tier 2 (Moderate) | JFSA / DFSA (Japan/Dubai) | Strong oversight with moderate flexibility and higher leverage allowances compared to Tier 1. |
| Tier 3 (Offshore) | FSA / FSC (Seychelles/Mauritius) | Highly flexible leverage limits (up to 500:1); minimal retail protection; exposes traders to high counterparty and insolvency risk. |
Furthermore, traders must understand how brokers route their orders:
- A-Book (ECN): The broker routes orders directly to the live exchange to match with other participants, making money purely on transparent commissions.
- B-Book (Market Makers): The broker takes the opposite side of your trade. This creates a massive conflict of interest—when you lose money, the broker profits.
- Payment for Order Flow (PFOF): Utilized by “zero-commission” brokers, they sell your order data to High-Frequency Trading (HFT) firms like Citadel *before* executing your trade, allowing the HFT firm to micro-arbitrage your order.
4. Fundamental Analysis: GDP, CPI, and Interest Rates
While technical analysis dictates the timing of trade entries, fundamental analysis dictates the long-term trajectory of assets. Equity valuations are inextricably linked to the macroeconomic trinity: Gross Domestic Product (GDP), the Consumer Price Index (CPI), and central bank interest rates.
Interest rates are the gravitational pull on financial markets. When inflation (CPI) runs hot, central banks raise rates to cool the economy. Higher interest rates increase corporate borrowing costs, limit business expansion, and increase the yield on risk-free government bonds. This exerts immense pressure on stock valuations, compressing the price-to-earnings (P/E) multiples investors are willing to pay for future cash flows. This dynamic heavily punishes growth and technology sectors, triggering massive capital rotation into defensive assets.
5. Intermarket Analysis: The Power of the US Dollar (DXY)
A critical linchpin in institutional quantitative analysis is the US Dollar Index (DXY), which measures the dollar against a basket of six major fiat currencies. The DXY exhibits profound inverse correlations with global asset prices.
Because the vast majority of global commodities (crude oil, gold, copper) are priced in USD, a rising DXY makes these commodities more expensive for foreign buyers, artificially suppressing global demand and driving commodity prices down. In emerging markets, a surging DXY can be catastrophic; emerging economies frequently hold dollar-denominated debt, and a rising dollar exponentially increases their debt-servicing costs, triggering capital flight and crushing equity valuations.
6. The Derivatives Market: Options, Futures, and The Greeks
Professional trading rarely involves simply buying and holding raw shares of stock. Institutional capital heavily relies on derivatives—financial contracts whose value is derived from an underlying asset.
Options Contracts give the buyer the right to buy or sell 100 shares of a stock at a specific “strike price” before an expiration date. You buy a Call Option if you believe the stock price will go UP, and a Put Option if you believe the stock price will go DOWN (or to hedge an existing portfolio). Options pricing is governed by the Black-Scholes model, which measures risk using “The Greeks”:
| The Greek | What it Measures | Impact on the Trader |
|---|---|---|
| Delta (Δ) | Directional Risk | How much the option’s price will change for every $1 move in the underlying stock. A Delta of 0.50 means the option gains $0.50 for every $1 the stock moves. |
| Gamma (Γ) | Acceleration | The rate of change of Delta. High Gamma means Delta will increase rapidly as the stock moves, creating explosive, compounding profits. |
| Theta (Θ) | Time Decay | The silent killer of option buyers. Theta represents the amount of value the option loses every single day as it gets closer to expiration. |
| Vega (ν) | Volatility Risk | Measures sensitivity to Implied Volatility (IV). If the market suddenly panics and becomes volatile, Vega causes the option price to spike, even if the stock price hasn’t moved yet. |
7. Order Flow, Dark Pools, and Level 2 Data
Standard retail charts only show what *has already happened*. To predict what *will* happen, professional day traders use Order Flow analysis to look inside the exchange matching engine.
Level 2 Data (Depth of Market) displays the actual order book, revealing all the resting limit orders above and below the current price. Traders look for massive clusters of orders to identify true, hidden support and resistance walls. Time and Sales (The Tape) provides a scrolling list of every executed transaction; “reading the tape” allows traders to spot aggressive institutional buyers slapping the “ask” price with massive volume.
Institutions cannot simply buy 500,000 shares at once without skyrocketing the price. To hide their footprints, they use Iceberg Orders (algorithms that only show 1,000 shares on the Level 2 book, continuously reloading to hide the true size) and Dark Pools. Dark pools are private, off-exchange networks where massive institutional blocks of shares are traded completely hidden from the public, ensuring that multi-billion dollar portfolio rebalancing doesn’t panic the retail market.
8. Navigating Market Cycles: Stan Weinstein’s Stage Analysis
Financial markets do not move in a linear fashion; they oscillate through defined cycles. Recognizing the prevailing market regime is paramount, as strategies that generate alpha in a bull market will systematically destroy capital in a sideways or bear market.
- Stage 1: Accumulation (The Basing Area). Price action moves sideways within a narrow range after a protracted decline as institutional “smart money” quietly accumulates shares. The 200-day moving average flattens out.
- Stage 2: Markup (The Bull Market). Initiated by a massive volume breakout. The asset forms higher highs and holds above the upward-sloping 200-day moving average. This is the optimal environment for aggressive trend-following.
- Stage 3: Distribution (The Topping Phase). The uptrend decelerates as institutions liquidate positions to late-arriving retail investors. Price action becomes erratic (“churning”). Traders must reduce exposure.
- Stage 4: Markdown (The Bear Market). The asset breaks below Stage 3 support, initiating a prolonged downtrend. The 200-day moving average acts as a ceiling of dynamic resistance. Buy-and-hold strategies fail; traders must pivot to capital preservation or short selling.
9. Advanced Technical Indicator Architectures
Technical indicators are mathematical derivatives of historical price, volume, and time data. Because no single indicator is infallible, professional trading systems combine non-correlated indicators across varying categories to confirm setups and avoid the illusion of confluence (e.g., stacking RSI and Stochastic together merely measures momentum twice).
A. Trend Identification Indicators
Trend indicators map the foundational stability and direction of the market, filtering out intraday noise.
- Moving Averages (SMA & EMA): The Simple Moving Average calculates the unweighted mean of closing prices. The Exponential Moving Average applies a weighting multiplier to prioritize recent price data, reducing lag. A “Golden Cross” occurs when the 50-day moving average crosses above the 200-day moving average, signaling a macro bullish shift. A “Death Cross” is the inverse bearish signal.
- Volume-Weighted Average Price (VWAP): An intraday indicator based on the total dollar value of all trades divided by total trading volume. It establishes the true average price participants paid, heavily utilized by institutions to assess fair value.
B. Momentum Oscillators (Velocity and Force)
Momentum indicators measure the velocity of price movements, quantifying abstract forces like supply and demand.
- Relative Strength Index (RSI): A bounded oscillator measuring the speed of price movements on a 0 to 100 scale. Readings above 70 indicate overbought conditions, while below 30 indicates oversold. Advanced traders look for Bullish/Bearish Divergences (e.g., price makes a lower low, but RSI makes a higher low), signaling that downward momentum is secretly exhausting itself.
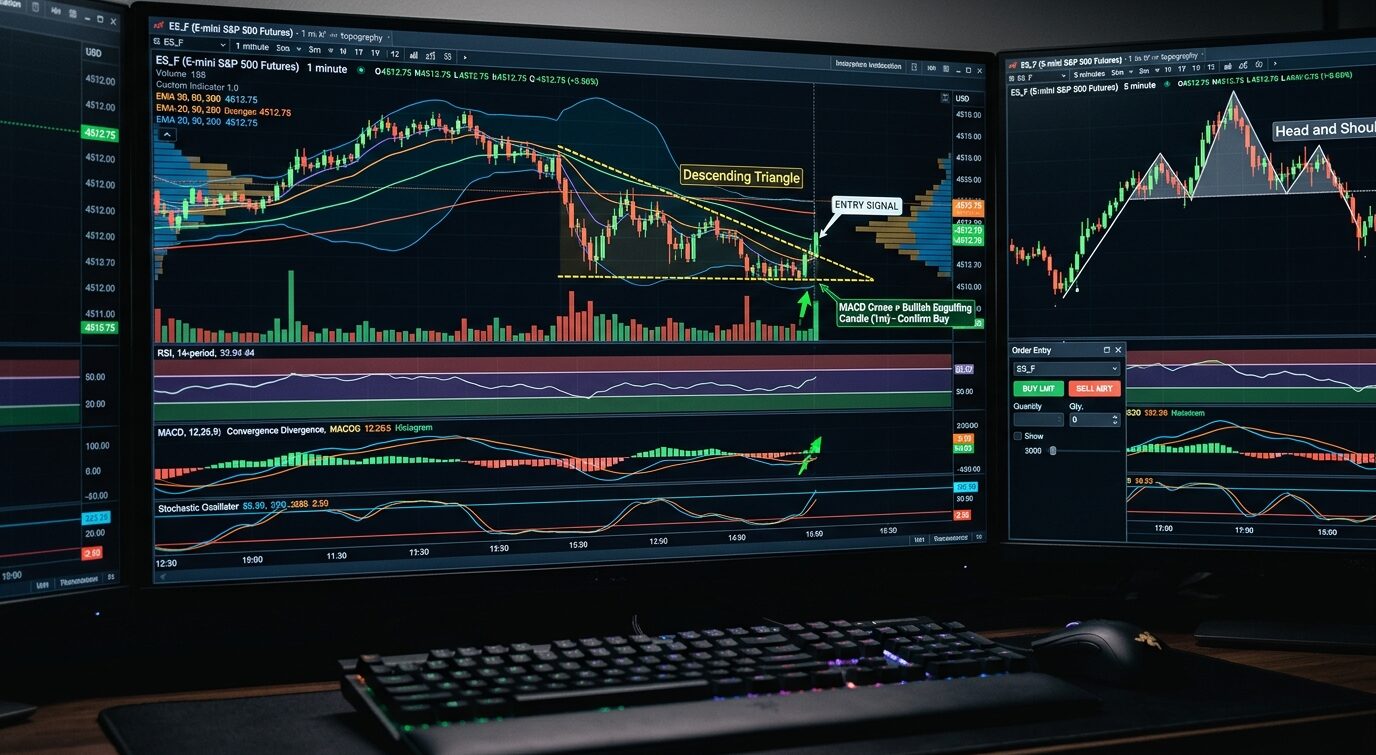
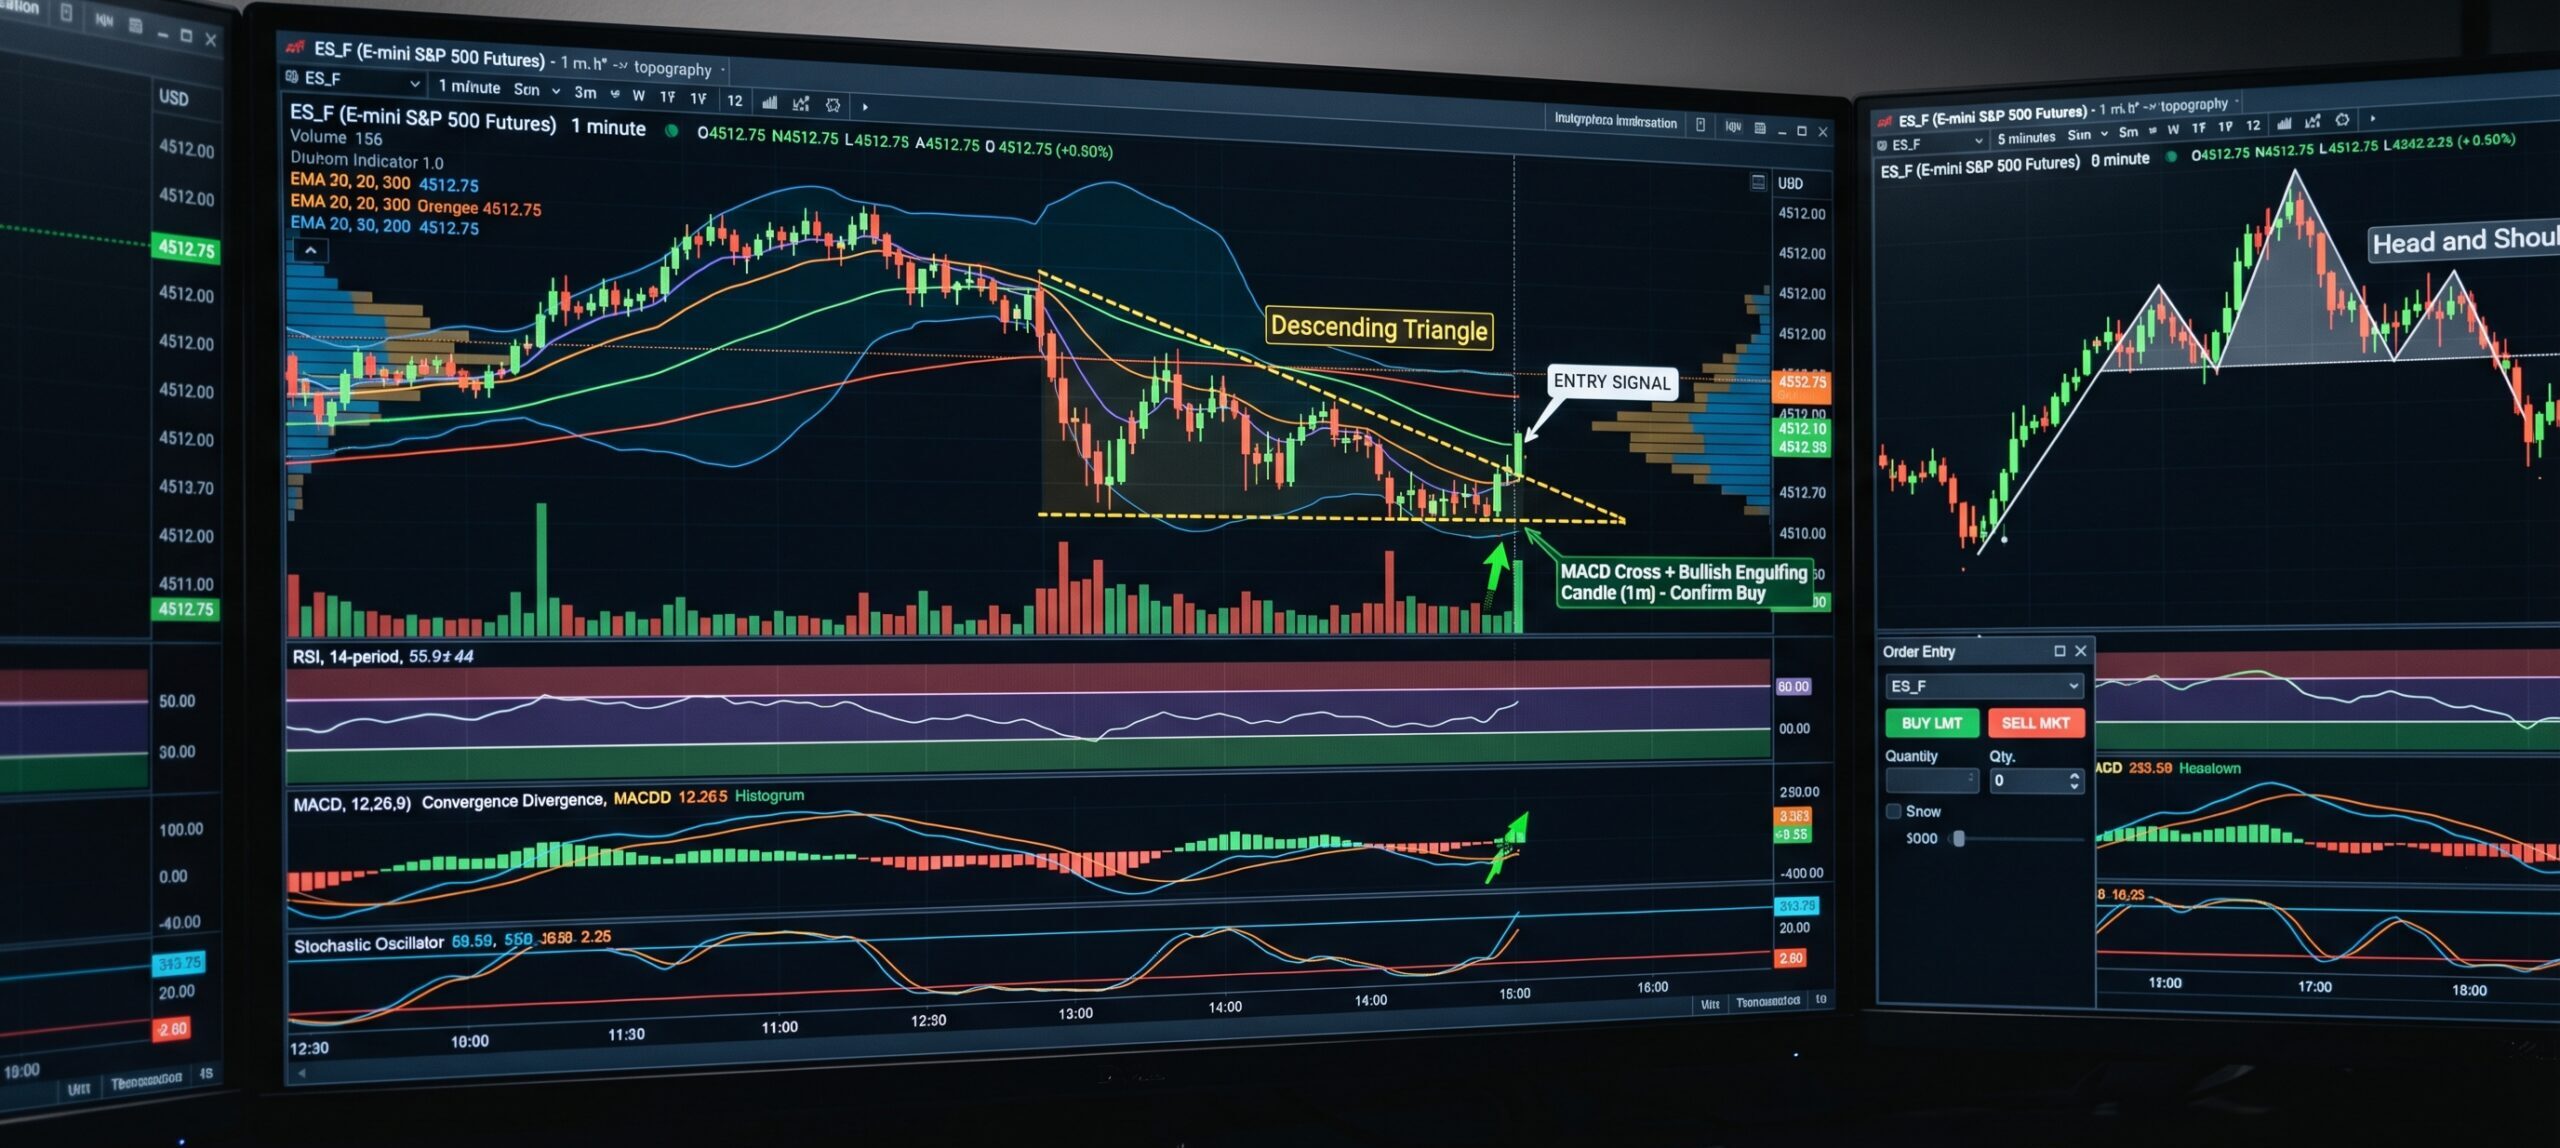
- MACD (Moving Average Convergence Divergence): Assesses dynamics by subtracting the 26-period EMA from the 12-period EMA. The crossover of the MACD line and the Signal line generates entry triggers, while the MACD Histogram visually represents expanding or shrinking momentum.
- Stochastic Oscillator: Measures the current closing price relative to the high-low range over a set period, highly effective in identifying turning points in a sideways, Stage 1 market.
C. Volatility and Boundary Mechanics
Volatility indicators define the mathematical boundaries of normal price fluctuation.
- Bollinger Bands: Consists of a 20-period SMA flanked by an upper and lower band calculated using standard deviations. A “Bollinger Squeeze” occurs when the bands converge tightly, indicating historically low volatility and predicting an explosive directional breakout.
- Average True Range (ATR): The ATR does not indicate trend direction; it solely measures absolute market volatility by analyzing the true range of recent candles. Institutional traders rely heavily on the ATR to calculate exact Trailing Stop-Loss placements to prevent being prematurely stopped out by normal market noise.
D. Volume and Institutional Support
- Fibonacci Retracements: Institutional analysts map hidden support utilizing the Fibonacci sequence. During an uptrend, pullbacks frequently exhaust themselves at geometric retracement levels, most notably the 61.8% Golden Ratio.
- Volume Profile: Unlike traditional volume at the bottom of the chart, Volume Profile displays trading activity at specific price levels on the Y-axis. The Point of Control (POC) identifies the exact price level where the most volume was executed, acting as a massive institutional magnet.
10. Price Action Topography and Candlestick Morphology
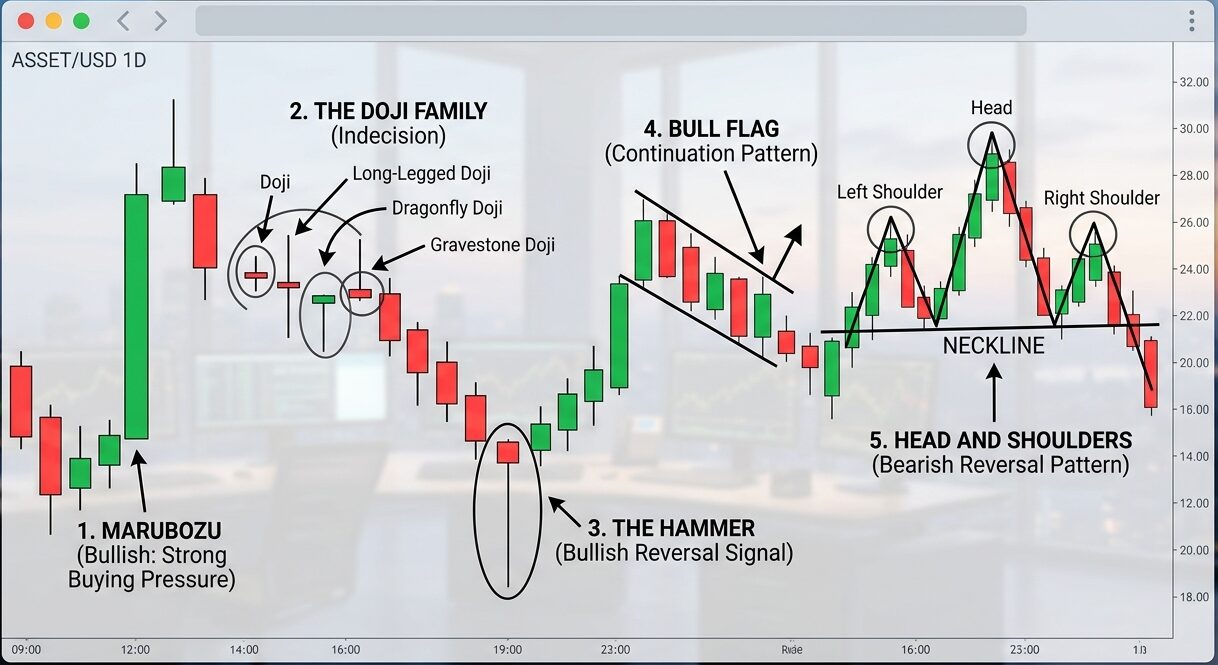
While indicators are inherently lagging, pure price action analysis allows traders to read the real-time psychological battle between buyers and sellers on the chart itself. Originating in 18th-century Japan, candlesticks display the open, high, low, and close of an asset. The size of the “real body” indicates directional conviction, while the “wicks” represent price rejection.
| Candlestick / Pattern | Psychological Sentiment & Structure |
|---|---|
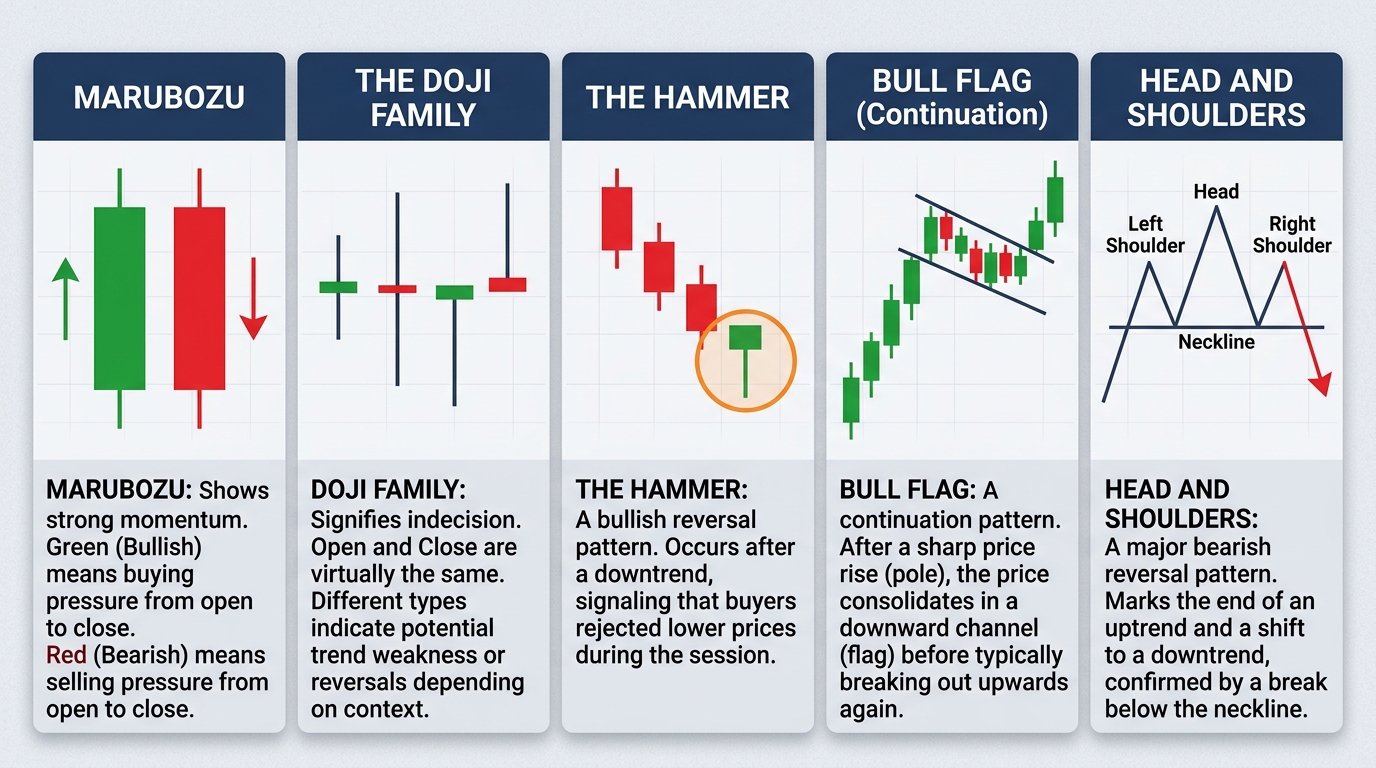
| Marubozu | A candle with zero upper or lower wicks. Indicates total directional conviction and dominance by buyers or sellers. |
| The Doji Family | Open and close are nearly identical. Signifies absolute market equilibrium and indecision. |
| The Hammer | Occurring at the bottom of a downtrend, a long lower wick demonstrates massive intraday selling pressure was completely absorbed and overwhelmed by buyers. |
| Bull Flag (Continuation) | A sharp upward rally followed by a downward-sloping consolidation channel on low volume, indicating a brief pause before explosive trend continuation. |
| Head and Shoulders | A premier reversal structure with three peaks. A break below the “neckline” triggers aggressive institutional short-selling. |
11. Algorithmic Infrastructure and the AI Evolution
Today, over 90% of global institutional trading volume is generated by non-human algorithmic entities. High-Frequency Trading (HFT) utilizes microwave transmission towers and server colocation to execute millions of orders in microseconds, capturing micro-arbitrage opportunities. Medium-frequency algorithms focus on broader structural inefficiencies, deploying Statistical Arbitrage (betting on the mean-reversion of two highly correlated assets) or complex momentum models.
By 2026, the retail and institutional trading landscape underwent a massive paradigm shift driven by Artificial Intelligence. Platforms now utilize ecosystems of highly specialized “AI agents”: one agent scrapes global news using Natural Language Processing (NLP) to gauge sentiment, another recognizes complex chart patterns in real-time, and a third dynamically manages trailing stops based on Deep Learning models that adapt to shifting market regimes without human intervention.
12. Mathematical Risk Management: The 1% Rule and Expectancy
Regardless of the sophistication of an algorithm, the human operator remains the most vulnerable point of failure. Professional traders deploy rigorous, mathematically robust frameworks to ensure long-term survival.
Fixed Fractional Position Sizing (The 1% Rule): This method protects against the “Risk of Ruin” by ensuring a trader only ever risks a fixed, minute percentage of their total equity (e.g., 1%) on any single trade. As the account suffers drawdowns, the absolute dollar value of the 1% risk dynamically shrinks, decelerating the rate of capital destruction and ensuring survival through inevitable losing streaks.
Professionals do not think in dollars; they think in Expectancy and R-Multiples. If you risk $100 on a trade (1R) and make $300, that is a +3R trade. To be profitable, you do not need a high win rate. If your strategy has a 40% win rate, but your average winning trade is +3R and your average losing trade is -1R, your mathematical expectancy is highly positive. You can lose the majority of your trades and still generate massive annual returns.
13. Behavioral Finance and Trading Psychology
Behavioral finance studies the cognitive biases that systematically sabotage rational economic decision-making. The market is fundamentally a mirror reflecting a trader’s own emotional flaws.
- FOMO (Fear Of Missing Out): The psychological urge to abandon your trading plan and impulsively buy a stock simply because it is rapidly rising. This almost always results in buying the absolute top right before the crash.
- Revenge Trading: After taking a painful loss, the trader’s ego is damaged. They immediately re-enter the market with double the position size to “win the money back,” acting out of anger rather than technical logic. This is the primary cause of blown accounts.
- The Sunk Cost Fallacy & Loss Aversion: Human psychology feels the pain of financial loss twice as intensely as pleasure. This causes traders to hold onto losing positions, hoping they will “break even,” rather than adhering to their stop-loss. Conversely, they cut winning positions prematurely out of fear the market will reverse.
- Confirmation Bias: A trader holding a losing long position will scour financial news for bullish opinions, actively ignoring structural breakdowns on the chart to validate their pre-existing hope.